Hi everyone,
I’ve been working on a new “Ticket Resolution Statistics” dashboard for the TicketPlus module, aimed at those who use Dolibarr’s native Ticket module as a helpdesk. A company from Spain paid for this development.
The goal is simply to make it easier to see how support is performing: response times, resolution times, and load per agent, using the ticket data that Dolibarr already stores.
It does not replace any core feature; it just provides an additional view focused on daily operations and time metrics calculated using the raw data stored in the native Ticket module and Agenda.
The dashboard includes the following UI elements:
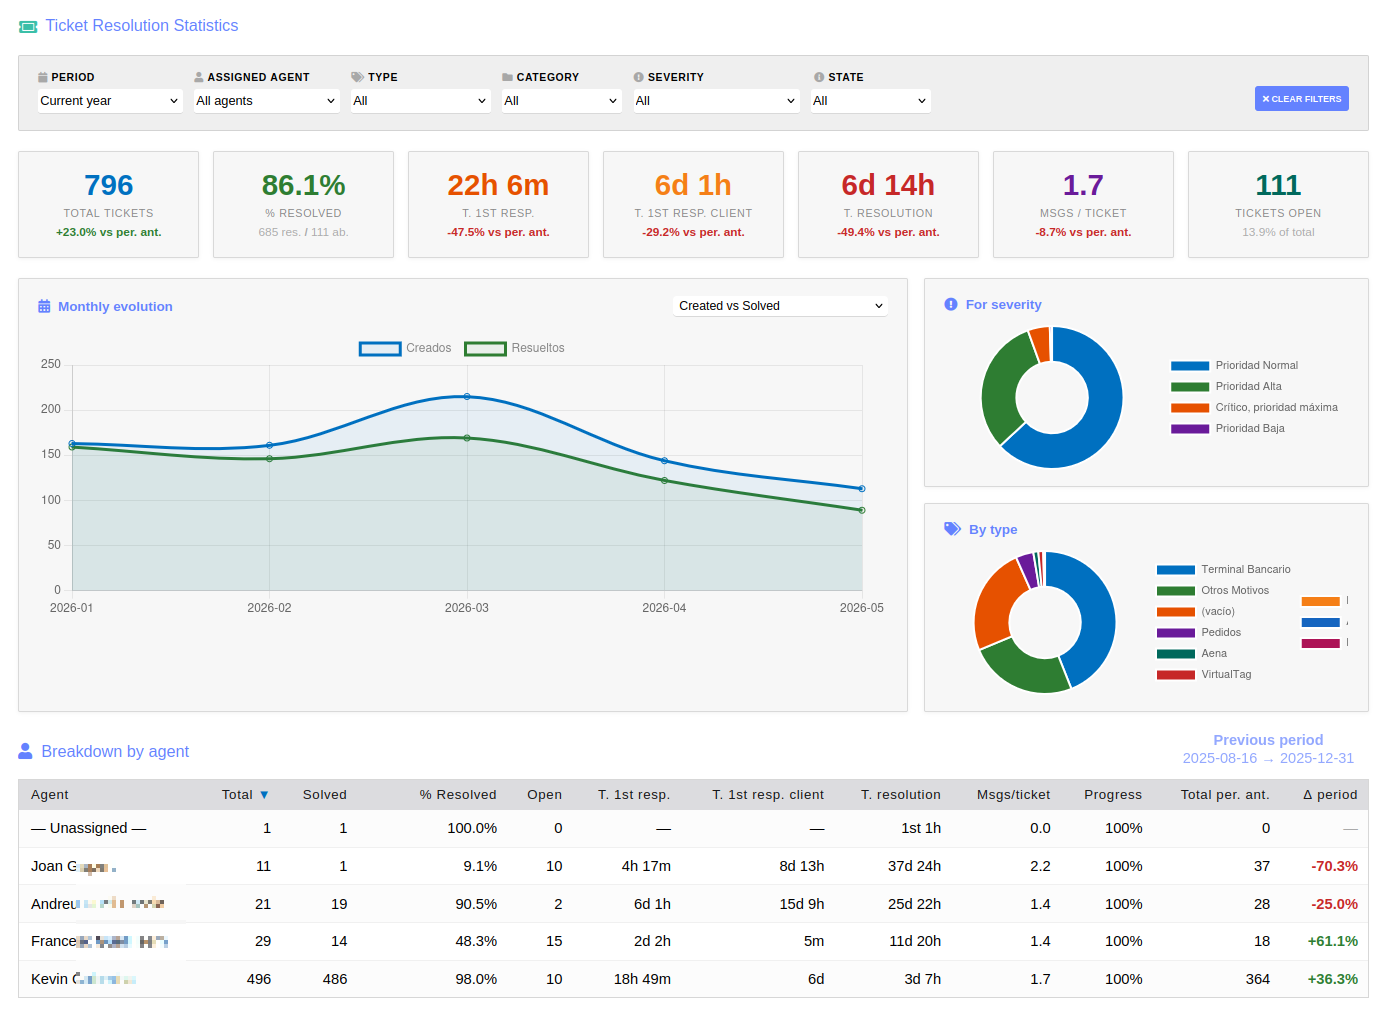
- Several filters: by period, agent, type, category, severity, and status,
- It shows several KPIs such as total tickets, percentage resolved, open tickets, average first reply time, average client reply time, and average resolution time,
- With automatic comparison against the previous period,
- There is also a monthly chart of created vs. resolved tickets,
- Plus donut charts by severity and by ticket type,
- At the bottom, a breakdown table by agent shows, for each operator, how many tickets they handled, resolved, and still have open, along with their average times and the evolution compared to the previous period.
Here is a screenshot in the thread so you can see how it looks in practice:
If you are already using the Ticket module for support and think some additional metric would be useful (for example, SLAs per customer or per project), feel free to share ideas and feedback so I can keep improving it. ![]()


